| I have ran logistics for several horse rides in my area, that consists of having a radio operator at water stops along a 50 mile course, and having them radio times of each horse back to base camp. This information would be collected so I can maintain accountability of each participant of the event. This way, we can see who is still on the trail. This system works well, however, when I have operators that don't want to abandon their location, but need to leave, Base Camp is asked for an ETA of that last rider. In this instance, I looked up some equations, calculated the average speed between previous checkpoints, factored in a hold time, and used it to estimate the ETA to the checkpoint requesting the information. I quickly realized this math could be automated. |
 |
| Analog Whiteboard for Data |
|
 |
| Raw Data Tab, with calculations |
| My first thought was to host a database on a PC, with a web portal to be used for data entry and display. The main reason for this mentality is i want to be able to enter data quickly via an iPad. When checkpoints call in, they give me a very quick dump of information. Something like "Base this is Water 1 - at 0821, horse number 103 and 107". With data moving quickly, I would like to select the water stop, then type the horse numbers, and the time. The database could put the data entry in the correct place automatically, without me having to scroll and find the field for each entry. I knew this can be done with Java, but I did not have the time to start building something that big from scratch. I began piecing this together as an Excel file, and created the equations to give me the ETA data of each point, based on historical data.
|
| I deployed my creation as Person & Event Tracker 1.0 (PET), and started using it with real data. I was able to let the checkpoints know what time to expect the first riders to arrive, within 5 minutes of the actual time they did arrive. This worked across the whole event, and I was able to have the base camp people ready when the lead horse arrived, proactive instead of reactive. With this information, I was also able to project times of the slow riders, and calculate their arrival time to the finish line. In once instance, I passed along data to the last checkpoint, to inform the riders to speed up or they will arrive 10 minutes past the cutoff time for the event. This also gave me the ability to inform the ride organizers that they needed to go break glow sticks along specific sections of the trail, an hour before sunset. This system was being proven as a great logistical support tool. |
 |
| Main Display Page on PET 1.0 |
|
 |
| Main Display Page with Next ETA Field on PET 1.5 |
| The really cool part of this system, was I embedded the Excel file into a webpage that was hosted on my computer. This allowed me to hand the ride organizers an iPad that would display the data I have for them, and automatically update every few minutes. This reduced the chatter between me and the organizers, as they could see the information they needed from their location.
While using this system, I occasionally needed information from my computer through my iPad but I was out of range of the wireless access point, with the auto refresh clearing the data on my screen. I made another page that would display the same data, without the auto refresh, allowing me to walk to the end timers, and collect more data, while still able to see main data. |
After a few lessons learned, and wanting to make the system easier for other people to start using, I revised the data entry table, to make it easier to use and lowering the risk of messing up the equations. I also added a "Next ETA" field to the main display, so the organizers can quickly see when the riders should arrive at the next checkpoint.
I am willing to share my work to others interested in tracking an event like this. My current version will track up to 200 people, and up to 10 checkpoints of calculations. I can expand this, but I wanted to keep the file size down for now. The current version does load on a 1st Generation iPad via Safari. The webpage is hosted on a Windows computer, running Internet Information Services as the hosting method. This could be used on a real website, to give this data to ride participants and support personnel if the Excel file is regularly uploaded to a public website. This version must be edited on a computer running either Excel or Open Office. Pages on the iPad will delete some of the complex equations because it does not support some of the methods I use for the math.
 |
Summary Tab
showing totals for each checkpoint
Used to see how many riders still need to go through a checkpoint. |
|
 |
Event Variables
Distances between checkpoints and hold times are entered here.
Accurate distances = Accurate ETAs |
|
 |
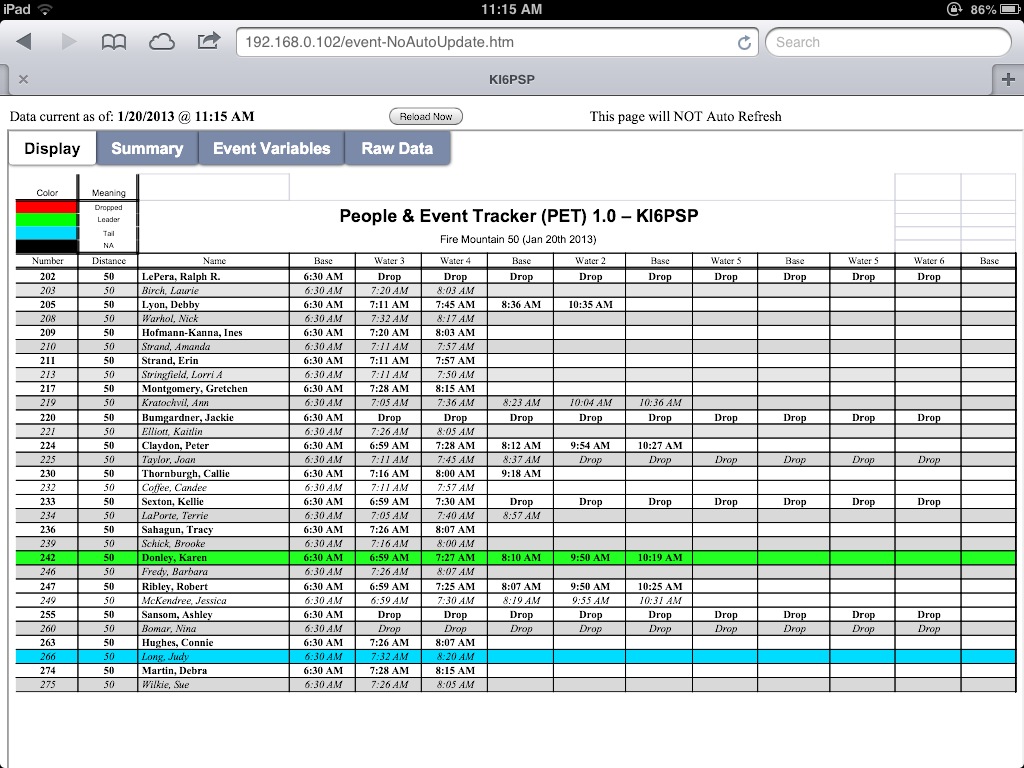
Raw Data
This is the main working tab, for data entry. The equations have been moved to protect them from changes. |
|
If you are interested, just send me an email or post here. My Email address is current on QRZ.COM


No comments:
Post a Comment